How Much Can I Save on Electricity Bills with Solar Panels in Perth? A Realistic 2026 Breakdown
The short answer: most Perth households with solar panels on a standard Synergy tariff cut their electricity bills by $1,400 to $2,500 per year, depending on system size and how much solar they use directly. A well-sized system with a battery can reduce a $2,800 annual bill to under $400.
That is not a marketing headline. It is a number you can verify against Synergy’s confirmed 2025–26 tariff of 32.37c/kWh and the Distributed Energy Buyback Scheme (DEBS) rates currently in force.
Key 2026 figures at a glance:
- Synergy Home Plan (A1) usage rate: 32.37c/kWh (effective 1 July 2025)
- Daily supply charge: $1.16/day (solar does not remove this)
- DEBS peak export rate (3pm–9pm): 10c/kWh
- DEBS off-peak export rate (all other times): 2.5c/kWh
- Perth average daily peak sun hours: 5.3–5.5 hours
This guide works through the maths honestly, system size by system size, so you can see what is realistic for your home before you speak to anyone.
Why Perth Is One of Australia’s Best Locations for Solar Savings
Perth receives more sunshine than almost any capital city in Australia. With 5.3 to 5.5 peak sun hours per day on average (and considerably more in summer), a solar panel here generates significantly more electricity per kilowatt of installed capacity than the same panel in Sydney or Melbourne.
That generation advantage combines with a high grid tariff to create strong financial returns. At 32.37c/kWh, every unit of solar you consume directly is worth nearly a third of a dollar in avoided grid costs. That is the core mechanic behind solar savings: not the feed-in tariff, but the grid electricity you stop buying.
The self-consumption principle
The most important concept in solar ROI: using 1 kWh of solar yourself saves you 32.37c. Exporting that same kWh to the grid earns you 2.5c to 10c under DEBS. The difference is enormous.
This is why daytime habits matter so much, and why a battery changes the equation so dramatically. The more solar you consume directly rather than export, the faster your payback and the higher your annual savings.
- Synergy’s DEBS peak rate (3pm–9pm): 10c/kWh exported
- Synergy’s DEBS off-peak rate (all other times): 2.5c/kWh exported
- Grid rate avoided by self-consuming: 32.37c/kWh
For most Perth households, exported solar averages out to roughly 3–4c/kWh across the full day, because the majority of generation happens in the off-peak window (9am–3pm) when solar output is highest but the DEBS rate is lowest. Self-consumption is where the real money is.
Annual Savings by System Size: What the Numbers Actually Look Like
The table below uses a standard Perth household consuming 20 kWh/day (7,300 kWh/year) as the baseline, with a pre-solar annual bill of approximately $2,790 in usage charges plus $423 in supply charges, totalling around $3,213 per year. Savings figures assume 50% self-consumption (typical for a working household out during the day) and a blended DEBS export rate of 3.5c/kWh.
| System Size | Est. Annual Generation | Annual Savings (no battery) | Payback Period | Annual Bill After Solar |
|---|---|---|---|---|
| 6.6 kW | ~9,900 kWh | $1,400–$1,700 | 3–4 years | ~$1,300–$1,600 |
| 10 kW | ~15,000 kWh | $2,000–$2,400 | 3.5–4.5 years | ~$800–$1,200 |
| 13 kW | ~19,500 kWh | $2,400–$2,800 | 4–5 years | ~$400–$800 |
Figures use Synergy’s confirmed 32.37c/kWh tariff and DEBS rates current as of 1 July 2025. System costs used for payback calculations are net of federal STC rebates.
Why a 6.6 kW system remains the most popular choice
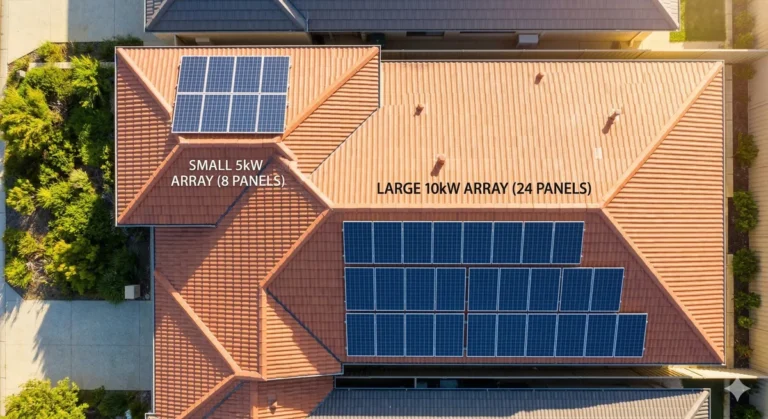
The 6.6 kW system hits the sweet spot between upfront cost and return. After federal STC rebates, a quality 6.6 kW system in Perth typically costs $4,200 to $7,200 installed. At $1,500 in annual savings, that is a payback of 3 to 5 years on a system with a 25-year panel warranty.
Going to 10 kW or 13 kW makes strong financial sense if:
- Your household consumes more than 25 kWh/day (common with ducted air conditioning, a pool, or an EV)
- You plan to add a battery now or in the future (a larger array charges a battery faster)
- You run a home office or have family members at home during the day
The 13 kW system, once considered oversized for residential use, is increasingly practical as WA households electrify more appliances and electricity prices continue to rise.
Worked Example: A $2,800 Bill Reduced to Under $400
Here is a realistic scenario based on a four-person Perth household that Talk Energy’s team encounters regularly.
The household:
- Daily consumption: 22 kWh/day (8,030 kWh/year)
- Synergy bill before solar: approximately $2,800/year in usage charges, plus $423 in supply charges = $3,223 total
- System installed: 13 kW solar + 13.5 kWh battery
- Self-consumption with battery: 85%
Step 1: Calculate solar generation
A 13 kW system in Perth generates approximately 19,500 kWh/year (13 kW x 5.3 hours/day x 365 days, accounting for system losses).
Step 2: Apply self-consumption savings
At 85% self-consumption, the household uses 16,575 kWh of solar directly per year.
Avoided grid cost: 16,575 kWh x $0.3237 = $5,367 in avoided electricity purchases
But the household only needs 8,030 kWh/year, so the effective avoided cost is capped at their actual consumption:
8,030 kWh x $0.3237 = $2,599 in avoided grid usage costs
Step 3: Add DEBS export credits
Remaining generation exported: approximately 11,470 kWh/year. At a blended DEBS rate of ~4c/kWh (weighted average of peak and off-peak exports):
11,470 kWh x $0.04 = $459 in DEBS credits
Step 4: Calculate the new annual bill
| Item | Before Solar | After Solar + Battery |
|---|---|---|
| Usage charges | $2,800 | ~$201 (residual grid top-up) |
| Supply charge | $423 | $423 (unchanged) |
| DEBS credits | $0 | -$459 |
| Total annual bill | $3,223 | ~$165 |
Total annual saving: approximately $3,058. Annual bill: under $200.
The supply charge cannot be eliminated with solar alone. It is a fixed daily charge from Synergy for maintaining your grid connection. Every Perth solar household still pays it. This is why the realistic floor for any solar household’s annual bill sits around $400 to $450, not zero.
Key takeaway: A 13 kW system with a battery can reduce a $2,800+ annual electricity bill to under $400. The supply charge ($423/year) is the only fixed cost that solar cannot eliminate.
How Your Daily Habits Affect Savings
Two households with identical 6.6 kW systems and identical consumption can have very different savings outcomes, purely based on when they use electricity.
Solar panels generate between roughly 8am and 5pm. The grid tariff applies any time you draw from Synergy. The more overlap between your consumption and your generation window, the more you save.
The self-consumption spectrum
| Household Profile | Self-Consumption Rate | Annual Savings (6.6 kW, no battery) |
|---|---|---|
| Retiree or work-from-home | 60–70% | $1,800–$2,100 |
| Standard working household | 40–50% | $1,400–$1,700 |
| Rarely home during the day | 25–35% | $900–$1,200 |
The practical implication is significant. A working couple who shift their dishwasher, washing machine, and pool pump to run between 9am and 3pm can add several hundred dollars to their annual savings without spending an extra cent. Energy.gov.au estimates that load-shifting appliances to solar hours is one of the most cost-effective ways to maximise solar returns.
Three habits that make a measurable difference
- Run the dishwasher at midday, not after dinner. A standard dishwasher draws 1.2–1.8 kWh per cycle. Running it on solar rather than grid power saves around $180–$215 per year.
- Set hot water systems to heat between 10am and 2pm. Hot water accounts for roughly 25% of a typical household’s energy use. A timer-controlled electric hot water system on solar hours can save $300–$500 per year on its own.
- Charge EVs during the day. If you have an EV, daytime charging on solar is worth $800–$1,500 per year compared to overnight grid charging at 32.37c/kWh.
The bottom line on habits: solar panels are not a set-and-forget device. Households that actively time their loads during generation hours consistently outperform those that do not, often by $400 to $600 per year on the same system.
Does Adding a Battery Make Financial Sense?
A home battery solves the self-consumption problem for working households. Instead of exporting surplus solar at 2.5c/kWh during the day, the battery stores it and releases it in the evening when you would otherwise be drawing from the grid at 32.37c/kWh.
The financial case for batteries in Perth has strengthened considerably as battery costs have fallen. A 10–13.5 kWh battery (the most common residential size) now typically adds $8,000 to $12,000 to a solar installation, and it changes the savings picture substantially.
Solar-only vs solar + battery: the comparison
| Scenario | Self-Consumption | Annual Savings | Annual Bill |
|---|---|---|---|
| 6.6 kW solar only | ~45% | $1,400–$1,700 | ~$1,300–$1,600 |
| 6.6 kW + 10 kWh battery | ~80% | $2,000–$2,300 | ~$700–$1,000 |
| 10 kW + 13.5 kWh battery | ~85% | $2,500–$2,900 | ~$300–$700 |
| 13 kW + 13.5 kWh battery | ~85–90% | $2,800–$3,100 | ~$100–$400 |
Figures based on 20 kWh/day household consumption and 2025–26 Synergy tariffs.
The WA Battery Scheme
Western Australian households may also be eligible to participate in the WA Battery Scheme, which provides rebates of up to $7,500 on eligible home batteries. This incentive significantly improves the payback period on battery storage, bringing it from a typical 7–10 years down to 4–6 years for many households.
The honest answer on batteries: if you are a working household that is out during the day and currently exporting most of your solar at 2.5c/kWh, a battery is almost certainly worth it. The incremental saving of $600 to $800 per year over solar-only, combined with available rebates, makes the maths compelling.
If you are already home during the day and self-consuming 60%+ of your solar, the battery adds less incremental value and the decision is more marginal. Talk to a reputable installer about your actual consumption profile before committing.
What These Numbers Mean for Your Specific Home
The figures in this guide are based on a representative Perth household. Your actual savings will vary based on:
- Your current consumption: Find your daily average by dividing your bi-monthly Synergy bill’s kWh total by 60. Households using 25+ kWh/day will see proportionally higher savings from a larger system.
- Your roof orientation and shading: A north-facing roof with no shading in Perth is close to optimal. East-west split systems can also perform well, with better morning and afternoon generation.
- Your daytime usage patterns: As covered above, this is the single biggest variable within your control.
- Your chosen system quality: Panel degradation rates vary. Premium panels from established manufacturers lose less output over 25 years, meaning the savings in year 20 are closer to the savings in year 1.
A note on payback periods
Payback periods quoted in this guide assume current Synergy tariffs. Electricity prices in WA have increased by roughly 2.5% per year over the past decade, according to wa.gov.au pricing records. If that trend continues, your solar savings will grow each year as the grid rate rises while your solar generation cost remains fixed.
At 2.5% annual tariff growth, a system that saves you $1,600 in year one will save approximately $2,050 in year ten. The payback period looks conservative from a ten-year perspective; it looks extremely conservative from a 25-year one.
The solar system itself does not change in cost after installation. That is the financial asymmetry that makes solar one of the few home improvements that genuinely compounds in value over time.
Get Your Free Savings Estimate from Talk Energy
The numbers in this guide give you a realistic framework, but the most accurate savings estimate comes from someone who has looked at your actual Synergy bills, your roof, and your household profile.
Talk Energy is Perth’s solar and battery specialist, with 250+ five-star reviews, in-house electricians, and a 20-year workmanship warranty. The team provides free, no-obligation savings estimates based on your real consumption data, not industry averages.
Get your free savings estimate from Talk Energy and find out exactly what solar would reduce your bill to, which system size suits your home, and whether a battery makes financial sense for your usage pattern.
There is no obligation, no sales pressure, and no guesswork. Just the numbers that apply to your home.